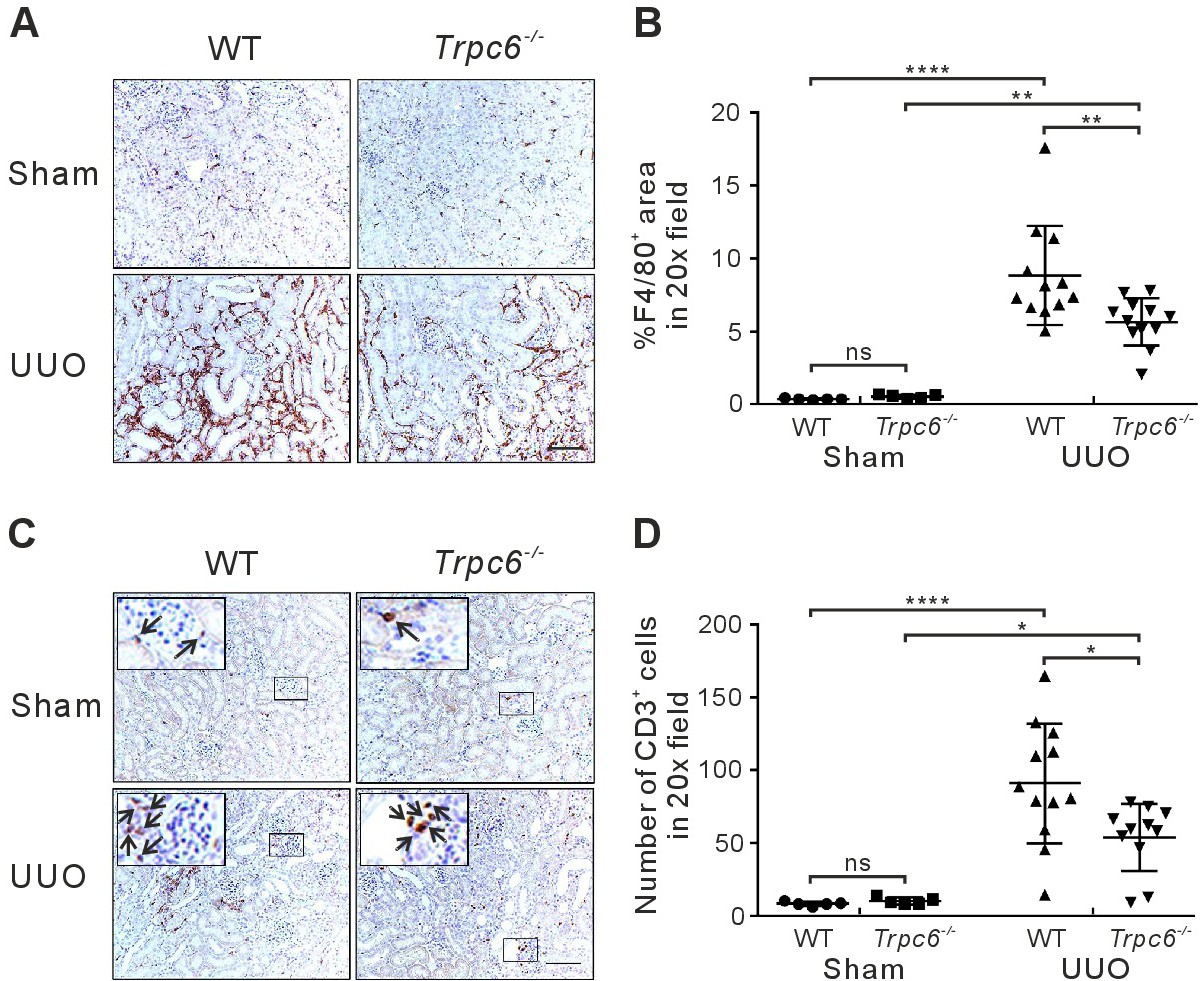
Fig. 3. Markers of inflammation in wild-type (WT) and Trpc6-/- kidneys. (A) F4/80 antibody staining: macrophage marker. (B) Quantification of the F4/80 positive areas. (C) CD3 antibody staining: T-cell marker. Arrows show positive cells (D) Quantification of the CD3 positive cells. WT and Trpc6-/- UUO-treated groups encompassed n=12 (WT) and n=11 (Trpc6-/-) kidney samples. All quantification data are means ± SD. ns p>0.05, *p<0.05, **p<0.01 and ****p<0.0001. WT and Trpc6-/- sham groups included n=5 kidney samples each. All images were taken at a magnification of 20x. Scale bar: 100 μm. ns, not significant.